


Grey relational analysis
To validate the hypothesis, this study aims to identify potential crucial variables and establish the impact relationships between these variables and the core variable, cognitive function. Given the multidisciplinary nature of the analysis and the high level of system uncertainty inherent in such studies, the grey relational analysis (GRA) method was selected as the primary analytical tool. GRA is particularly suited for systems with incomplete or uncertain information, which is often the case in multidisciplinary studies involving cognitive function. The method allows for the initial assessment of the directions and strengths of the impacts of various factors by measuring the degree of association between them. The degree of association quantifies the magnitude of correlation, which can vary over time or among different subjects within the system. Specifically, if the trends of two factors are consistent—meaning they change synchronously to a high degree—they are considered to have a high level of association. Conversely, if their trends are inconsistent, the association is deemed low. Thus, GRA provides a quantitative description and comparison of a system’s changes and development, making it a robust tool for identifying key variables influencing cognitive function. One of the key advantages of GRA is its ability to handle small sample sizes and incomplete data, which is particularly beneficial in studies where data collection may be challenging. Additionally, GRA does not require the data to follow a specific distribution, making it more flexible compared to other statistical methods.
As indicated in Table 4, the application of GRA in this study revealed that the main differences in cognitive levels are associated with urbanization differences and age intervals. Additionally, the regional economic digital level and light pollution level were identified as significant correlating factors affecting cognitive levels. The correlation index, which ranges from 0 to 1, showed that the closer the index is to 1, the more closely related the cognitive abilities of seniors are to the main variables.
$$\:{{\updelta\:}}_{\text{i}}\left(\text{k}\right)=\frac{\underset{\text{s}}{\text{min}}\underset{\text{t}}{\text{min}}\left|{\text{x}}_{0}\right(\text{t})-{\text{x}}_{\text{s}}(\text{t}\left)\right|+\underset{\text{s}}{{\uprho\:max}}\underset{\text{t}}{\text{max}}\left|{\text{x}}_{0}\right(\text{t})-{\text{x}}_{\text{s}}(\text{t}\left)\right|}{\left|{\text{x}}_{0}\right(\text{k})-{\text{x}}_{\text{i}}(\text{k}\left)\right|+{\uprho\:}\underset{\text{s}}{\text{max}}\underset{\text{t}}{\text{max}}\left|{\text{x}}_{0}\right(\text{t})-{\text{x}}_{\text{s}}(\text{t}\left)\right|}$$
(9)
Serial multiple mediator model
After identifying key variables influencing the cognitive abilities of middle-aged and elderly individuals through Gray Relational Analysis, this study further quantifies the degree of association and explores the mechanisms of action between these variables. To achieve this, a serial mediation model is employed, which is particularly well-suited for uncovering the detailed pathways and mechanisms through which urban development and individual characteristics jointly affect cognitive abilities [49]. By controlling for individual effects, such as age, the study compares cognitive performance across different urban development trajectories. Additionally, the use of mediating effects further explores the specific effects and the direct and indirect mechanisms and pathways of influence between factors affecting the cognitive abilities of seniors.
$$\:{CI}_{it}=Constant+{{\alpha\:}_{1}DE}_{it}+{\alpha\:}_{2}AGE+{e1}_{it}$$
(10)
$$\:{UR}_{it}=Constant+{{\beta\:}_{1}DE}_{it}+{\beta\:}_{2}{AGE}_{it}+{e2}_{it}$$
(11)
$$\:{DN}_{it}=Constant+{{\gamma\:}_{1}DE}_{it}+{\gamma\:}_{2}{AGE}_{it}+{e3}_{it}$$
(12)
$$\:{UR}_{it}=Constant+{{\lambda\:}_{1}DN}_{it}+{\lambda\:}_{2}{AGE}_{it}+{e4}_{it}$$
(13)
$$\:{CI}_{it}=Constant+{{\theta\:}_{1}DN}_{it}+{\theta\:}_{2}{AGE}_{it}+{e5}_{it}$$
(14)
$$\:{CI}_{it}=Constant+{{\rho\:}_{1}UR}_{it}+{\rho\:}_{2}{AGE}_{it}+{e6}_{it}$$
(15)
$$\begin{aligned}{CI}_{it}=&Constant+{\delta}_{1}{DE}_{it}+{\delta}_{2}{DN}_{it}\\&+{\delta}_{3}UR_{it}+{\delta}_{4}{AGE}_{it}+{e7}_{it}\end{aligned}$$
(16)
As shown in Tables 5, 6 and 7; Fig. 3, from the perspective of direct effects, there are three main paths: DE = >CI (effect value = 0.198, p < 0.001), DE = >DN (effect value = 0.793, p < 0.001), and DE = >UR (effect value = 0.819, p < 0.001). Overall, DE has a significant positive impact on UR, CI, and DN. This suggests that regions with more developed digital economies tend to have higher levels of urbanization, which, in turn, leads to increased light pollution, which proves the hypothesis 1a, 1b. Additionally, as an emerging force in economic development, the digital economy effectively enhances the cognitive abilities of the elderly, confirming Hypothesis 1c. The digital economy plays a particularly vital role, by expanding internet access, it fosters online social networks and support systems, reducing loneliness and social isolation—both of which are linked to cognitive decline [53]. Additionally, advancements in big data enhance healthcare precision [54], the rise of technologies like the Internet of Things further facilitates real-time health monitoring and customized care, ultimately benefiting seniors’ cognitive health.

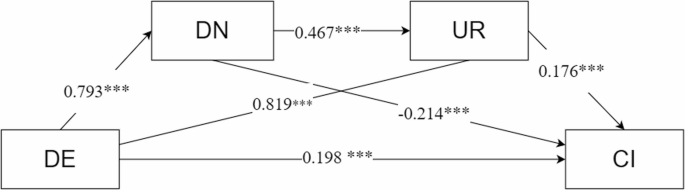
Mediating effect path diagram
Furthermore, the three paths—DN = > UR (effect value = 0.467, p < 0.001), DN = > CI (effect value = −0.214, p < 0.001), and UR = > CI (effect value = −0.214, p < 0.001).On the one hand, light intensity (DN) is both a key feature of urban landscapes, driving the development of urbanization. However, it also negatively impacts the cognitive abilities of seniors. While the light intensity (DN)_and urbanization (UR) contribute to cognitive function score (CI) in older adults. The light intensity contributes to the light pollution for the elderly, and as numerous studies have shown, it will cause detrimental effects to the senior population and decrease cognitive function through various mechanisms, and it proves the Hypothesis 2. Notably, a cognitive gap exists between urban and rural elderly populations. Urban areas, with superior healthcare and higher internet accessibility, provide better cognitive support than rural regions.
According to the total effect path Eq. (14), DE = > DN = > UR = > CI (effect value = 0.238, p < 0.001), DE positively affects CI through DN and UR. This indicates that the impact of digital economy development on the cognitive levels of elderly individuals in cities with different levels of light pollution is also influenced by urbanization. Generally speaking, light pollution affects the cognitive abilities of the elderly, as prolonged exposure to urban lighting can disrupt sleep patterns, thereby exacerbating health issues. The more developed the urbanization, the more severe the light pollution tends to be. However, the results of the total effect analysis indicate that the combined benefits of the digital economy and urbanization in offering cognitive health resources surpass the adverse effects of light pollution on cognitive abilities, thereby demonstrating a positive impact, which validates Hypothesis 3.
This study examines the interactions among the digital economy, urban light pollution, cognitive function scores, and urbanization levels. The findings are consistent with previous literature, indicating that light pollution (DN) may disrupt circadian rhythms and sleep quality, thereby negatively affecting cognitive function (CI). Additionally, this study further reveals that the digital economy (DE) enhances cognitive abilities (CI) by increasing digital engagement Furthermore, while urbanization is promoted by the development of the digital economy, higher urbanization levels (UR) also contribute to improved cognitive abilities (CI). Crucially, this study highlights the interplay among these four factors: in regions with a highly developed digital economy and high levels of urbanization, the cognitive benefits brought by digital engagement may partially offset the adverse effects of light pollution, thereby mitigating cognitive decline among the elderly.
Robustness test
Boostrap test
And to test the robustness of the mediation effect, our research also employed bootstrapping produces, resampling 5000 times and creating 95% confidence interval. According to Table 8, the indirect effect of CI on middle-aged and elderly people through UR and DN is significant(\(\:{{\updelta\:}}_{1}\)= −0.065, p < 0.01, CI = [0.058, 0.073]).
Sobel-Goodman test
Following Sobel [55], we performed the Sobel-Goodman test to assess the validity of the mediating effects. The results are presented in Table 9, which shows that the direct, indirect and total effects of DE on CI with and without the mediators are all statistically significant at 1% level.
2SLS test
To further test for endogeneity within the mediation effect, this research employs the Two-Stage Least Squares (2SLS) method (Table 10). Specifically, to address potential endogeneity in the explanatory variables, urbanization (UR) is used as an instrumental variable (IV).
To formally test for endogeneity, we conduct the Durbin-Wu-Hausman (DWH) test [56]. The results of the DWH test, presented in Table 11, strongly reject the null hypothesis of exogeneity at the 99% confidence level, which confirms that DN is indeed an endogenous explanatory variable in this study. The rejection of the null hypothesis underscores the necessity of using the 2SLS method, as standard OLS estimates would be biased and inconsistent due to the presence of endogeneity. By employing urbanization as an instrumental variable, we ensure that the estimates of the mediation effect are robust and reliable.
Coupled coordination degree model (CCD)
The coupling coordination model is a tool used to assess and measure the interaction and coordination level of development between two or more indicators or systems. This model consists of two components: the coupling degree C value and the coordination index T value. When two or more systems or elements interact, they can either promote or inhibit each other. The coupling degree C value reflects the degree of connection and dependency among these elements, while the coordination index T value reflects the level of harmony in their joint development. Together, these form the coupling coordination degree D value.
$$\:C={\left(\frac{\prod\:_{i=1}^{n}{U}_{i}}{{\left(\frac{1}{n}\sum\:_{i=1}^{n}{U}_{i}\right)}^{n}}\right)}^{\frac{1}{n}}$$
(17)
$$\:C={\left(\frac{\prod\:_{i=1}^{3}{U}_{i}}{{\left(\frac{1}{3}\sum\:_{i=1}^{3}{U}_{i}\right)}^{3}}\right)}^{\frac{1}{3}}$$
(18)
$$\:T=\sum\:_{i=1}^{3}{{w}_{i}U}_{i}$$
(19)
$$\:D=\sqrt{C\times\:T}$$
(20)
Considering the different directions of indicator impacts, this research includes CE and DE as positive influence indicators, while DN, which acts contrary to the former two, is included as a negative influence indicator. In Eq. 20, D is derived by taking the square root of the product of C and T, where C measures the tightness of the combination of the three dimensions CI, DE, and DN for the current individual, and T describes the overall development level of the individual sample regarding these three dimensions. The weights \(\:{\text{w}}_{1},{\text{w}}_{2}\:\text{a}\text{n}\text{d}\:\:{\text{w}}_{3}\) in Eq. 19, which represent the respective weights of the three indicators, are assigned equal importance, reflecting the current Chinese advocacy for sustainable development policies. In the previous part of this paper, the individual was the core unit of research, but in CCD, all individuals belonging to the same prefecture-level city are consolidated, shifting the research scale from micro to macro, with the city as the new research unit, focusing on exploring the impact of sustainable digital economy development and light pollution spillover effects on senior well-being between cities.
After processing, this research obtained a total of 112 valid city samples (Table 12). Following the annotation of existing data, spatial interpolation of the data was performed to produce Fig. 4. In this map, areas with darker-colors indicate lower levels of overall coordination, while lighter colors correspond to higher coordination levels. Cities are divided into northern and southern regions based on the Qinling-Huaihe Line (latitude 33°N), with southern cities making up 52.6% of the total sample. The overall coupling coordination ranking displays a geographical distribution characteristic of being higher in the north and lower in the south, and higher in the east and lower in the west. Horizontally, darker colored areas are distributed in the central and eastern regions of China, and the vast western regions, where accurate data are unavailable, are left blank. Vertically, the coordination levels of northern cities significantly surpass those of southern cities. Among the top 40, 65% are northern cities, while the last 13 cities are all southern cities. This spatial distribution reflects the imbalance in the coupling coordination between the levels of digital economy development, the corresponding light pollution, and the cognitive levels of seniors across different regions in China.

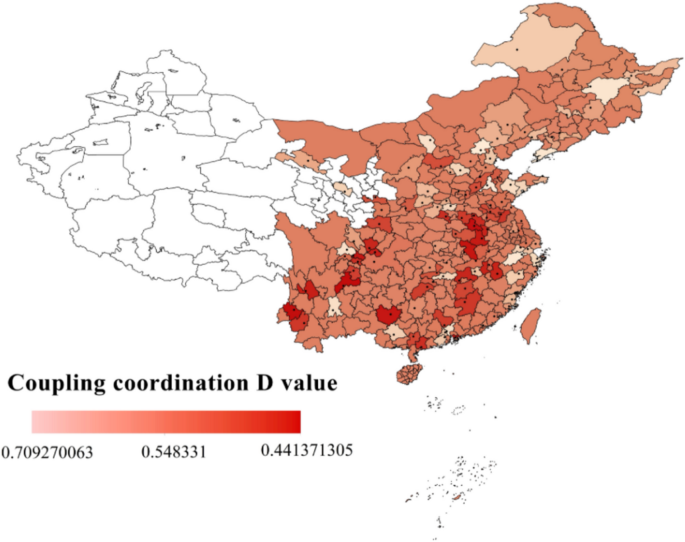
Results of Coupled Coordination Degree Model on Geospatial
Furthermore, from the numerical perspective, if 0.6 is set as the passing line for sustainable coordinated development of cities, only 17 cities in the sample meet this standard, representing less than 16% overall. This indicates that most cities in China currently struggle to balance the rapid development of the digital economy with the proper management of its negative impacts. Among the 17 cities that meet the standard, 15 are large cities with an average three-year population exceeding 5 million, while the other two are the provincial capitals Hohhot in Inner Mongolia and Lanzhou in Gansu. This sufficiently demonstrates that China’s large and important cities play a leading role in sustainable development of the digital economy. However, mega-cities such as Shanghai and Chongqing rank only in the middle, while the rapidly developing city of Shenzhen ranks third from last, indicating that some cities in China excessively pursue efficiency at the expense of quality, necessitating further adjustment.
The observed heterogeneity across regions reflects distinct urbanization patterns and economic structures. Along China’s eastern coastal cities, digital economy development is highly advanced, and while these regions experience higher levels of light pollution, the economic benefits of nighttime illumination—such as increased social engagement, entertainment, and economic activity—appear to outweigh its negative effects on cognitive function. As a result, elderly individuals in these areas tend to have better cognitive abilities despite higher levels of light exposure.
Longitudinally, the overall coupling coordination of northern cities is better than that of southern cities; first, Yin’s study significant differences in the urban expansion process of northern and southern cities, with southern cities growing in area and expanding at a significantly greater rate than their northern counterparts [57]. Traditionally, northern cities are usually earlier industrialized cities (e.g., Beijing and Tianjin). In contrast, southern cities have experienced rapid urban expansion in the past two decades, often prioritizing urban aesthetics and economic growth over environmental concerns. This rapid urbanization has led to greater emphasis on nighttime illumination as a symbol of urban prosperity, resulting in higher levels of light pollution. While urban night lighting contributes to the visual appeal and branding of modern cities, excessive artificial illumination can exceed the environmental carrying capacity, leading to negative externalities such as ecological disruption, reduced human well-being, and potential long-term cognitive risks.
link